Understanding Probability & Mathematical Randomness in 2-Digit Draws
📑 Table of Contents (Click to Jump)
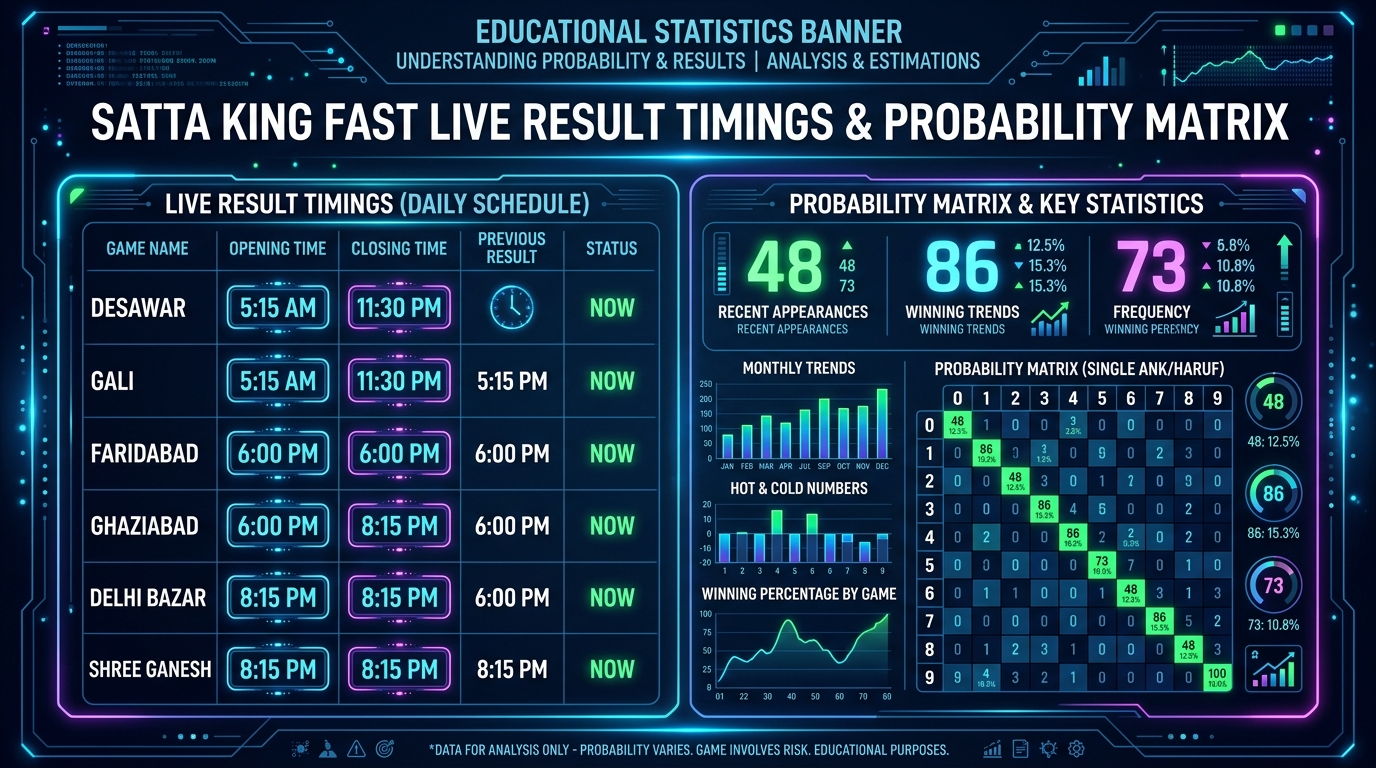
Many participants and enthusiasts attempt to identify numerical patterns in past draw charts. However, analyzing 2-digit draws from a mathematical perspective reveals why every outcome is entirely independent and random.
1. The 1-in-100 Independent Event Principle
In any standard 2-digit market (ranging from 00 to 99), there are exactly 100 possible outcomes. Assuming a fair draw mechanism, each number has an identical probability of being selected on any given day:
$$\text{Probability } P(E) = \frac{1}{100} = 0.01 = 1\%$$
Crucially, past draw results do not alter the sample space of future draws. If number 45 is drawn today, its probability of appearing tomorrow remains exactly 1%.
2. The Gambler's Fallacy Explained
The Gambler's Fallacy is the mistaken belief that if a specific number has not appeared for a long period ("cold number"), it is "due" to appear soon. In independent probability, numbers have no memory. Past chart data displayed on tables like Disawar Satta Chart serve as historical logs, not predictive indicators.
3. Law of Large Numbers
Over thousands of simulated draws, the distribution of units (Bahar) and tens (Ander) digits approaches an even 10% representation for each digit (0 through 9). Short-term clusters are normal statistical fluctuations rather than intentional patterns.